
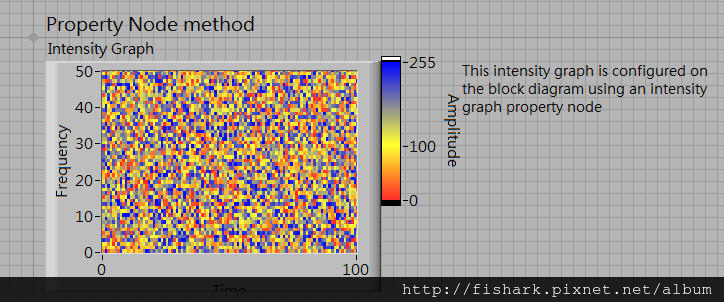
很久以前有用過Color Table的工能,也就是將圖形資料標上不同的顏色,
比如說數值0是紅色,數值255是藍色,數值在0~255 之間就會從紅色到藍色漸層變化,
有點像氣候圖,或是高度圖等,這對數據視覺化的呈現相當有幫助。
LabVIEW 提供Color Table功能,可以參考下列網頁:
How Can I Change the Color on an Intensity Graph or Chart?
https://digital.ni.com/public.nsf/allkb/1ADFF221E27F5B5886256E6F007C7B58
以下是Front panel
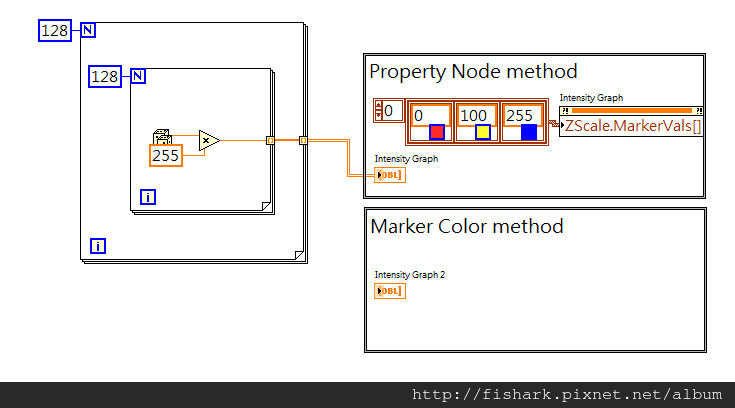
Block Diagram
文章作者: Jack
版權聲明: 本部落格所有文章除特別聲明外,均採用CC BY-NC-SA 4.0 授權協議。轉載請註明來源 X Workshop|量測自動化 × 嵌入式 × AI 開發實戰!
相關推薦
2021-02-16
[第2期]使用LabVIEW Python Node與OpenCV來讀取圖片/Use LabVIEW Python Node and OpenCV to read image
本影片介紹如何使用LabVIEW Python Node與OpenCV來讀取圖片。 This video shows how to use LabVIEW Python Node and OpenCV to read image. 步驟 Steps: 使用命令提示字元安裝OpenCV Install openCV in Comand Prompt 完成OpenCV讀取圖片的函數 Complete ReadImage() function 用Python Node呼叫讀圖的函數 Call function by Python Node
2020-10-02
[LabVIEW] Get stock data from yahoo finance by LabVIEW/使用LabVIEW獲取yahoo財經上的股票資料
This example shows how to use LabVIEW to get stock data from yahoo finance 這個範例說明如何使用LabVIEW擷取yahoo財經上的股票資料 get yahoo finance data by using LabVIEW 使用LabVIEW擷取Yahoo財經的資料 Use HTTP Client VIs to get web content 使用HTTP Client的VIs來獲取網頁內容 Determine the data range you want to get 決定想要獲取的資料範圍 Select data range by using Match Pattern VI 使用Match Pattern VI選擇資料範圍 Find one row data by using Match Pattern VI 使用Match Pattern VI尋找一列資料 Find add row data by using Match Pattern VI 使用Match Pattern ...
2020-01-04
[LabVIEW 2018][Voice] How to use Python Node to communicate with Python 如何使用Python Node與Python溝通
This example show steps of using Python Node to communicate with Python 這個範例說明如何使用Python Node與Python 溝通 Step 1. Install traditional Python 3.6 or 2.7 which LabVIEW 2008 Python Node supported. Step 2. Setup the system path of Python 3.6 or 2.7 Step 3. Tell python file path and function name to Python Node 步驟1. 安裝傳統的 Python 3.6 或 2.7 ,是目前LabVIEW 2008 Python Node有支援的 步驟2. 設定Python的環境變數 步驟3. 告訴Python Node Python檔案路徑與所想呼叫的函數名稱 Note: If your LabVIEW2018 is 32 bits, install Python 3.6 32 bits versio...
2021-05-23
[第5期]Dobot Magician robotic arm Introduction/Dobot Magician機器手臂簡介
This video gives the brief introduction of Dobot Magicain robotic arm and provides some documents and resources. 這個視頻提供簡單的Dobot Magician機器手臂的簡介,以及一些文件與資源。 Content: Software & Driver Installation Documents & Resources 內容如下: 軟體與驅動程式的安裝 文件與資源 References: CH340 Drivers for Windows, Mac and Linux https://sparks.gogo.co.nz/ch340.html Magician Studio v1.9.4 https://www.dobot.cc/downloadcenter/dobot-magician.html?sub\_cat=70#sub-download Dobot Magician User Manual https://ipt...
2021-05-29
[第6期]Write LabVIEW VISA program to control Dobot Magician/撰寫LabVIEW VISA程式來控制Dobot Magician
This video shows how to control Dobot Magician by writing LabVIEW VISA program. The content includes: Protocol description of PTP mode command Write Protocol by VISA to control Dobot Magician 這個視頻說明如何撰寫LabVIEW VISA程式來控制Dobot Magician。 內容為: 通訊指令說明 (PTP mode command) 用VISA寫傳輸指令來控制Dobot Magician 參考資料/References: Dobot Communication Protocol https://www.dobot.cc/downloadcenter/dobot-magician.html?sub\_cat=72#sub-download Communicating with the Dobot Magician using raw protocol ht...
2008-12-13
[贊助區-LabVIEW] 文章內容檢索
新網站連結: https://labview-tech.blogspot.com/ 贊助區說明在贊助區的文章並非免費文章、觀看方法請聯絡 : jacklee3633@gmail.com 文章分類 **一. ComPactRIO / FPGA 使用CompactRIO的crio 9211模組量測溫度的FPGA程式**[簡介]文章內容描述如何建立CompactRIO的FPGA程式、從建立CompactRIO裝置、到增加FPGA Target 、並在FPGA新增crio 9211模組與模組I/O, 建立FPGA VI, 接著Compile與部署至FPGA硬體、結果展示出利用crio 9211模組的IO來量測Thermocouple的數值、呈現在Waveform Chart上。 文章連結 : https://blog.pixnet.net/fishark/post/13147389 二. Vision Development module 影像處理 1. 使用Vision Assistant來進行脣形的辨識[簡介]這個例子是使用Visio...
公告
本站文章自痞客邦(2006–2024)搬家而來,舊文章的程式碼與圖片如有缺漏,歡迎留言告知。